)
Stackers are driven by curiosity.
So when faced with a 60-page OpenStack User Survey report, covering nearly as many questions and more than 1,600 responses, it’s natural to have a ton of questions like, “What would happen if you cut the data like this?” or “What if we looked only at production deployments on this question?”
We soon realized there were a lot more questions than hours in a data scientist’s day. And the User Survey has always been a hands-on community tool, reporting both positive and critical feedback and findings.
To respond to this curiosity, the OpenStack Foundation developed a user-friendly dashboard—a playground for the data-minded, a graphical way to answer complicated questions and digest big-picture findings.
Inspired by OpenStack’s Stackalytics dashboard, we poured in 18 months of data from the User Survey going back to the August 2015 reporting period.
While the User Survey reports are a snapshot in time, the survey analysis tool continuously accepts and analyzes answers to give you the most current data from the community.
As a result, online analysis results will vary from the full-length reports because they’re based on different samples. The reports also undergo data validation (including confirming or addressing outliers) to ensure reported stats are accurate. In the dashboard, outliers have not been manually confirmed for accuracy.
As the User Survey approaches its ninth iteration, the community’s interest in it shows no sign of slowing. In fact, survey results were mentioned by multiple speakers at nearly every 2016 OpenStack Days event.
The report and the new analysis tool are intended to serve different functions. The report, which will next be released in advance of the Boston Summit in 2017, features pages of in-depth comments and narrative analysis. The survey analysis tool, available now at openstack.org/analytics, is open and updated year-round, so findings are always fresh.
The OpenStack Foundation will continue to make bi-annual requests for users to update their survey data and new users to begin a survey. In the first half of the year, the focus is on gathering data from the users at large—regardless of if they have a deployment—and results will be available in the survey analysis tool and analyzed in the report. In the second half of the year, the focus is on updating deployment information, producing a more streamlined data set.
Start analyzing the User Survey now
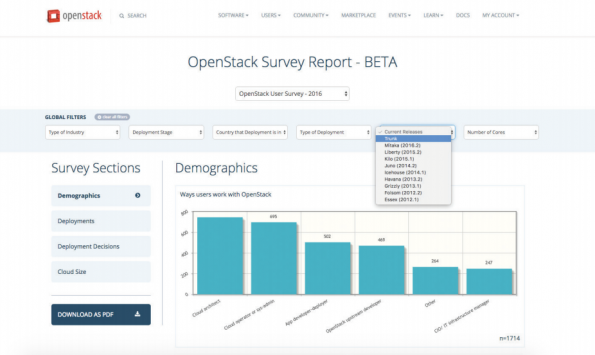
Are you ready to uncover the User Survey findings that most interest you? Try the survey reporting tool: openstack.org/analytics. At the top of the page, select the date range (2015 or 2016) that you want to dig into.Next, choose global filters to apply to the data. There are dozens of way to configure these options:
- Industry (segment by 10 options)
- Deployment stage (segment by clouds in production, testing or proof-of-concept)
- Location of deployment (segment by country)
- Type of deployment (segment public, private or community clouds)
- Software release (segment by version)
- Number of cores (segment by deployment size)
Keep in mind that as you apply more filters, particularly as you apply multiple global filters, the number of answers will be limited. The dash-board automatically hides data when the query produces such a small data set that it could risk exposing users’ private information. You can add or subtract global filters at any time as you explore data sets on demographics, deployments, deployment decisions and cloud size.The survey analysis tool is in beta and we encourage feedback. Contact the Foundation’s User Survey lead, Heidi Joy Tretheway, at [email protected]. You can also read past User Survey reports and submit your own data at http://openstack.org/user-survey.
At the OpenStack Summit in Barcelona, Heidi Joy Tretheway, senior marketing manager from the Foundation, and Jonathan Proulx, senior technical architect at MIT, discuss the importance of the User Survey in the relationship between users and developers and explore the findings of this round’s results. The pair also introduces the new User Survey dashboard, which allows individuals to apply up to six global filters on data from this user survey and examine it through a variety of lenses.
Cover Photo // CC BY NC
- OpenStack Days Melbourne: a tipping point in cloud technology - June 5, 2017
- OpenStack Summit veterans share their best tips for newbies - May 1, 2017
- OpenStack User Survey shows wider adoption, larger clouds - April 24, 2017