)
Gnocchi is the time series database-as-a-service (TDBaaS) project started under Ceilometer. Gnocchi’s latest version,1.3.1 was recently released.
We’ve received good feedback on Gnocchi so far, even though we have only had a little of it. Recently, in order to have a better feeling of where we were at, we wanted to know how fast (or slow) Gnocchi was.
The early benchmarks that some of the Mirantis engineers ran last year showed pretty good signs. But a year later, it was time to get real numbers and have a good understanding of Gnocchi capacity.
Benchmark tools
The first thing I realized when starting the process is that we were lacking the tools to run benchmarks. Therefore, I started to write some benchmark tools in the python-gnocchiclient, which provides a command line tool to interrogate Gnocchi. I added a few basic commands to measure metric performance, such as:
$ gnocchi benchmark metric create -w 48 -n 10000 -a low
+----------------------+------------------+
| Field                | Value            |
+----------------------+------------------+
| client workers       | 48               |
| create executed      | 10000            |
| create failures      | 0                |
| create failures rate | 0.00 %           |
| create runtime       | 8.80 seconds     |
| create speed         | 1136.96 create/s |
| delete executed      | 10000            |
| delete failures      | 0                |
| delete failures rate | 0.00 %           |
| delete runtime       | 39.56 seconds    |
| delete speed         | 252.75 delete/s  |
+----------------------+------------------+
The command line tool supports the –verbose switch to have detailed progress report on the benchmark progression. So far it supports metric operations only, but that’s the most interesting part of Gnocchi.
Spinning up some hardware
I got a couple of bare metal servers to test Gnocchi on. I dedicated the first one to Gnocchi, and used the second one as the benchmark client, plugged on the same network. Each server is made of 2×Intel Xeon E5-2609 v3 (12 cores in total) and 32 GB of RAM. That provides a lot of CPU to handle requests in parallel.
Then I simply performed a basic RHEL 7 installation and ran devstack to spin up an installation of Gnocchi based on the master branch, disabling all of the others OpenStack components. I then tweaked the Apache httpd configuration to use the worker MPM and increased the maximum number of clients that can sent request simultaneously.
I configured Gnocchi to use the PostsgreSQL indexer, as it’s the recommended one, and the file storage driver, based on Carbonara (Gnocchi own storage engine). That means files were stored locally rather than in Ceph or Swift. Using the file driver is less scalable (you have to run on only one node or uses a technology like NFS to share the files), but it was good enough for this benchmark and to have some numbers and profiling the beast.
The OpenStack Keystone authentication middleware was not enabled in this setup, as it would add some delay validating the authentication token.
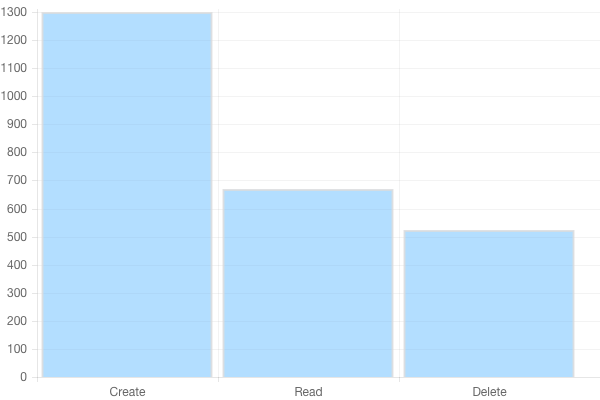
Metric CRUD operations
Metric creation is pretty fast. I managed to attain 1500 metric/s created pretty easily. Deletion is now asynchronous, which means it’s faster than in Gnocchi 1.2, but it’s still slower than creation: 300 metric/s can be deleted. That does not sound like a huge issue since metric deletion is actually barely used in production.
Retrieving metric information is also pretty fast and goes up to 800 metric/s. It’d be easy to achieve very higher throughput for this one, as it’d be easy to cache, but we didn’t feel the need to implement it so far.
Another important thing is that all of these numbers are constant and barely depends on the number of the metric already managed by Gnocchi.

Sending and getting measures
Pushing measures into metrics is one of the hottest topic. Starting with Gnocchi 1.1, the measures pushed are treated asynchronously, which makes it much faster to push new measures. Getting new numbers on that feature was pretty interesting.
The number of metric per second you can push depends on the batch size, meaning the number of actual measurements you send per call. The naive approach is to push 1 measure per call, and in that case, Gnocchi is able to handle around 600 measures/s. With a batch containing 100 measures, the number of calls per second goes down to 450, but since you push 100 measures each time, that means 45k measures per second pushed into Gnocchi!
I’ve pushed the test further, inspired by the recent blog post of InfluxDB claiming to achieve 300k points per second with their new engine. I ran the same benchmark on the hardware I had, which is roughly two times smaller than the one they used. I achieved to push Gnocchi to a little more than 120k measurement per second. If I had same hardware as they used, I could interpolate the results to achieve almost 250k measures/s pushed. Obviously, you can’t strictly compare Gnocchi and InfluxDB since they are not doing exactly the same thing, but it still looks way better than what I expected.
Using smaller batch sizes of 1k or 2k improve the throughput further to around 125k measures/s.
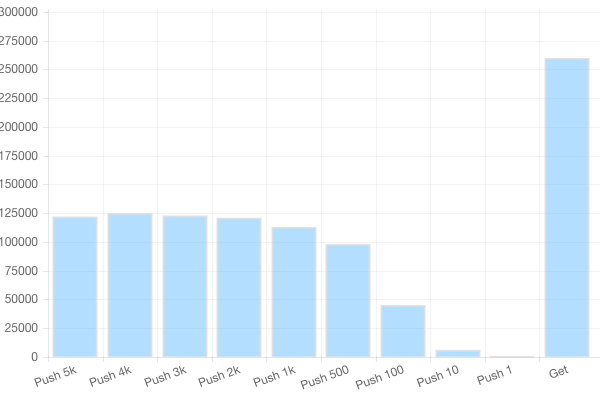
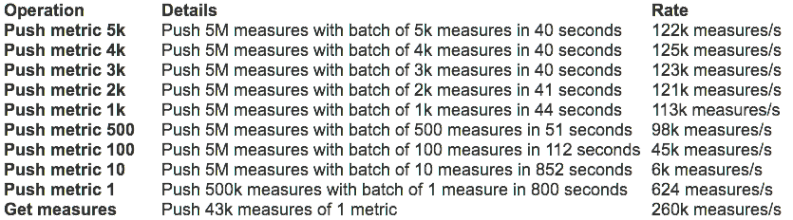
What about getting measures? Well, it’s actually pretty fast too. Retrieving a metric with 1 month of data with 1 minute interval (that’s 43k points) takes less than 2 second.
Though it’s actually slower than what I expected. The reason seems to be that the JSON is 2 MB big and encoding it takes a lot of time for Python. I’ll investigate that. Another point I discovered, is that by default Gnocchi returns all the datapoints for each granularities available for the asked period, which might double the size of the returned data for nothing if you don’t need it. It’ll be easy to add an option to the API to only retrieve what you need though!
Once benchmarked, that meant I was able to retrieve 6 metric/s per second, which translates to around 260k measures/s.
Metricd speed
New measures that are pushed into Gnocchi are processed asynchronously by the gnocchi-metricd daemon. When doing the benchmarks above, I ran into a very interesting issue: sending 10k measures on a metric would make gnocchi-metricd uses up to 2 GB RAM and 120 % CPU for more than 10 minutes.
After further investigation, I found that the naive approach we used to resample datapoints in Carbonara using Pandas was causing that. I reported a bug on Pandas and the upstream author was kind enough to provide a nice workaround, that I sent as a pull request to Pandas documentation.
I wrote a fix for Gnocchi based on that, and started using it. Computing the standard aggregation methods set (std, count, 95pct, min, max, sum, median, mean) for 10k batches of 1 measure (worst case scenario) for one metric with 10k measures now takes only 20 seconds and uses 100 MB of RAM – 45× faster. That means that in normal operations, where only a few new measures are processed, the operation of updating a metric only takes a few milliseconds. Awesome!
Comparison with Ceilometer
For comparison sake, I’ve quickly run some read operations benchmark in Ceilometer. I’ve fed it with one month of samples for 100 instances polled every minute. That represents roughly 4.3M samples injected, and that took a while – almost 1 hour whereas it would have taken less than a minute in Gnocchi. Then I tried to retrieve some statistics in the same way that we provide them in Gnocchi, which mean aggregating them over a period of 60 seconds over a month.
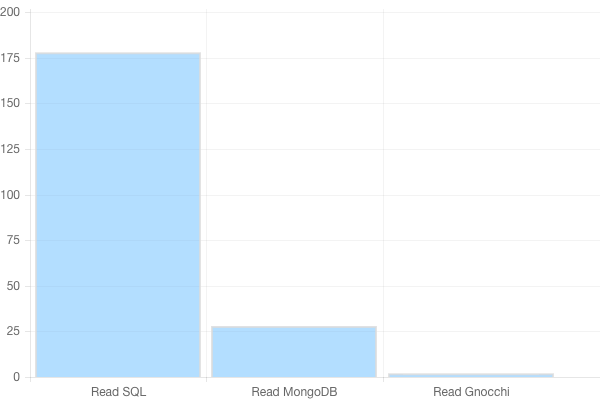

Obviously, Ceilometer is very slow. It has to look into 4M of samples to compute and return the result, which takes a lot of time. Whereas Gnocchi just has to fetch a file and pass it over. That also means that the more samples you have (so the more time you collect data and the more resources you have), slower Ceilometer will become. This is not a problem with Gnocchi, as I emphasized when I started designing it.
Most Gnocchi operations are O(log R) where R is the number of metrics or resources, whereas most Ceilometer operations are O(log S) where S is the number of samples (measures). Since is R millions of time smaller than S, Gnocchi gets to be much faster.
And what’s even more interesting, is that Gnocchi is entirely scalable horizontally. Adding more Gnocchi servers (for the API and its background processing worker metricd) will multiply Gnocchi performances by the number of servers added.
Improvements
There are several things to improve in Gnocchi, such as splitting Carbonara archives to make them more efficient, especially from drivers such as Ceph and Swift. It’s already on my plate, and I’m looking forwarding to working on that!
And if you have any questions, feel free to shoot them in the comment section.
- Ceilometer gets major performance boost - January 19, 2016
- Benchmarking Gnocchi for fun and profit - December 1, 2015
- Ceilometer, Gnocchi and Aodh: Liberty progress - August 6, 2015