)
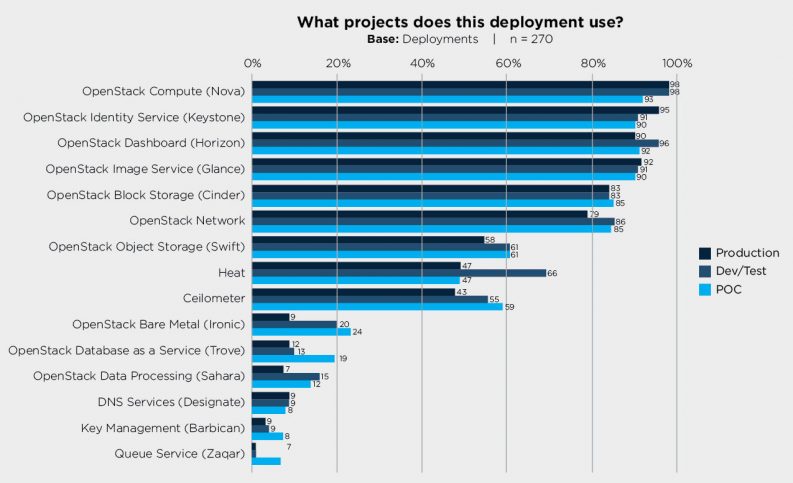
Some of OpenStack’s founding projects — including Nova, Keystone, Glance, Horizon and Cinder — continue to be the most popular. That may be changing, however. For starters, the inclusion of bare-metal provisioning project Ironic in the integrated release led to an increase across all deployment stages, including production, test and running a proof-of-concept (POC). Other projects, including Heat, Ceilometer, Swift and Trove, are also gaining in adoption, according to the recent User Survey.
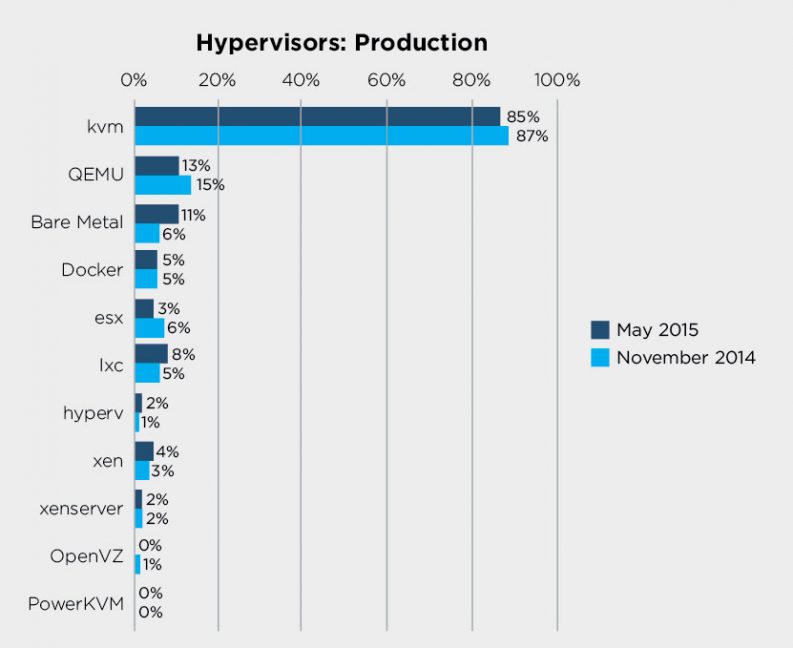
Kernel-based Virtual Machine (KVM) remains the most popular hypervisor, though a rush of bare metal deployments, up 5 percent, was seen over the past six months.
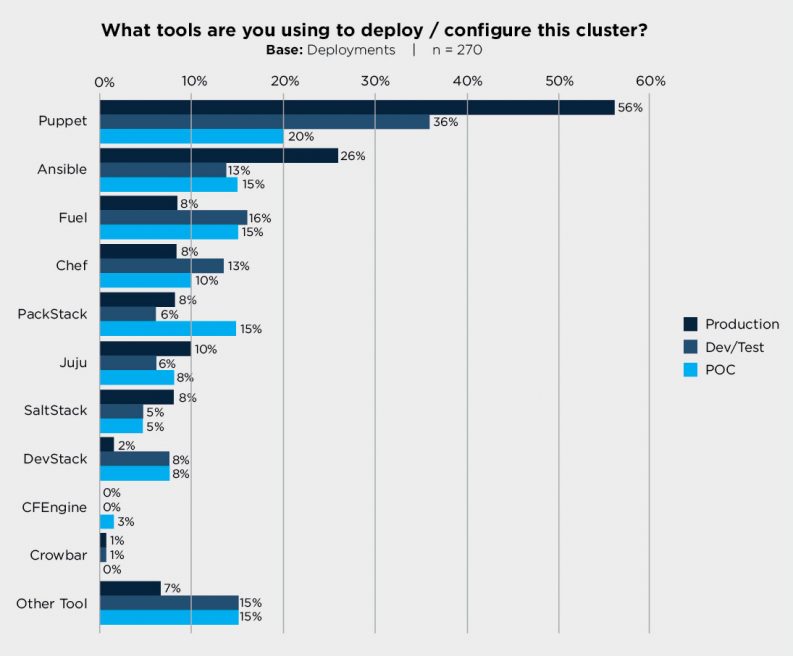
Puppet continues to retain a strong lead as deployment tool of choice, with more than half of production deployments using Puppet as one of their tools.
Those are some of the key takeaways from the fifth consecutive survey conducted by the OpenStack User Committee. The User Committee sounds out people working with OpenStack ahead of each Summit. These results are from voluntary surveys answered online between March 9, 2015 – April 16, 2015. The opt-in survey is not an exhaustive catalog of OpenStack deployments, but provides valuable intelligence on usage patterns and technology decisions in real-world deployments.
This the second in a three-part series analyzing the most recent OpenStack user survey. Part one focused on demographics and business drivers. This post is an analysis of deployment details, including project usage, size trends and tools. Part three will share app developer insights.
Project Usage
Ironic’s inclusion in the integrated release has spurred its popularity, with an even spread of users running it in production (up 4 percent), testing it (up 12 percent), or running a proof-of-concept (up 4 percent). The large number of production deployments of Designate at this early stage indicates a real need being satisfied by this component. Nova, Keystone, Glance, Horizon and Cinder remain the most popular projects. However, all others show significant gains in production deployments compared to last survey: Heat (up 15 percent), Ceilometer (up 10 percent) Swift (up 9 percent), Neutron (up 9 percent), Trove (up 3 percent).
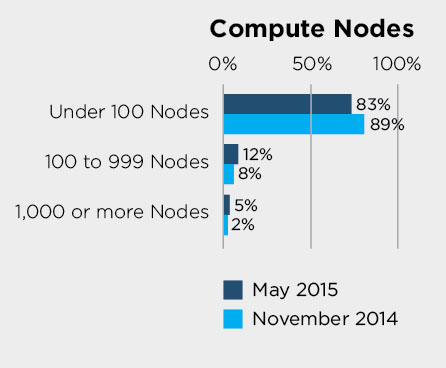
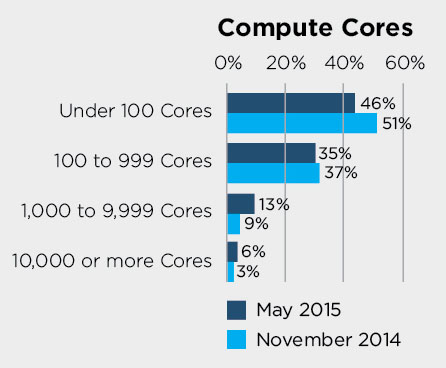
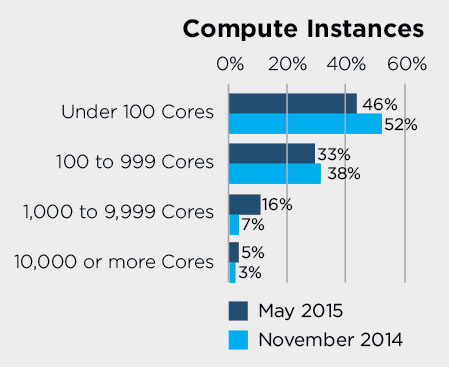
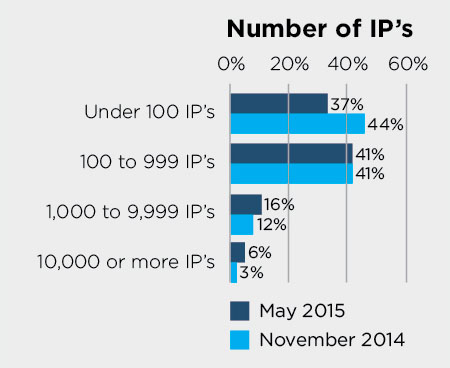
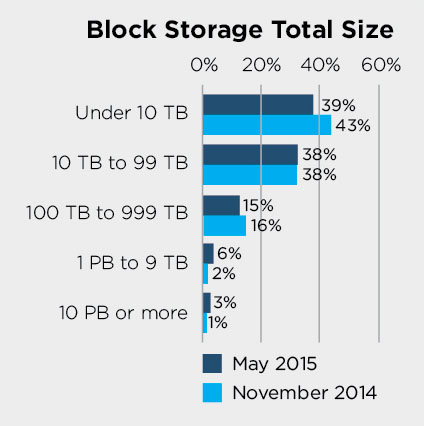
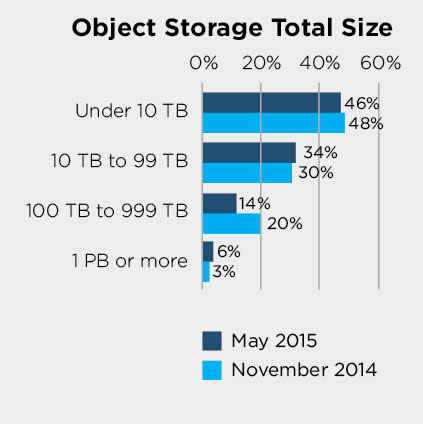
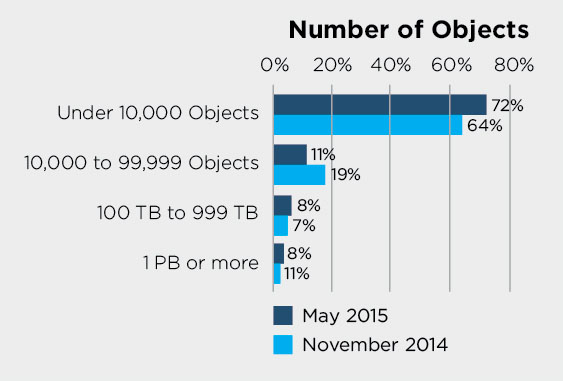
Size Trends
On the size front: everything keeps getting bigger. The average response to questions about number of compute nodes, cores, instances, IP addresses and storage sizes increased across the board for the large-scale end of things.
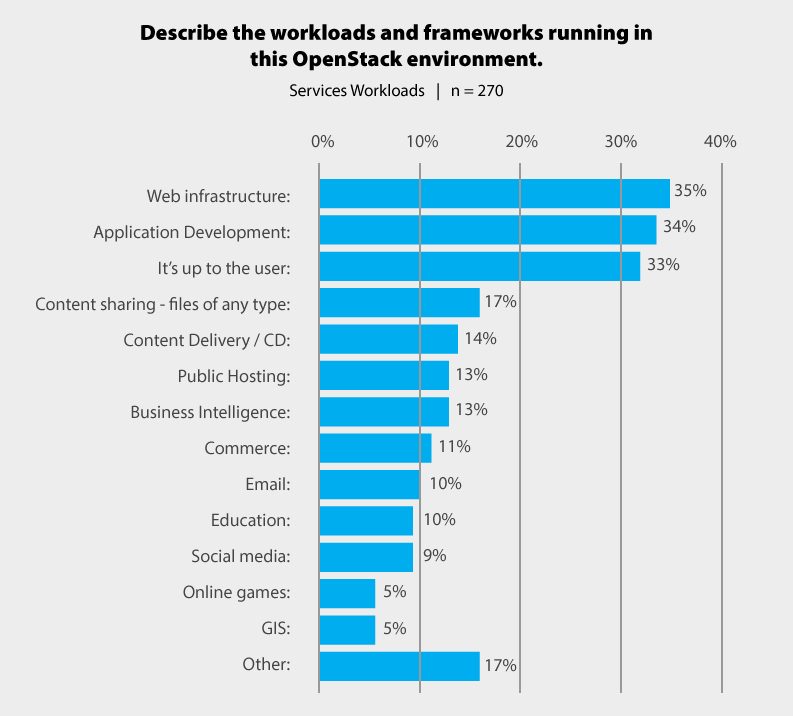
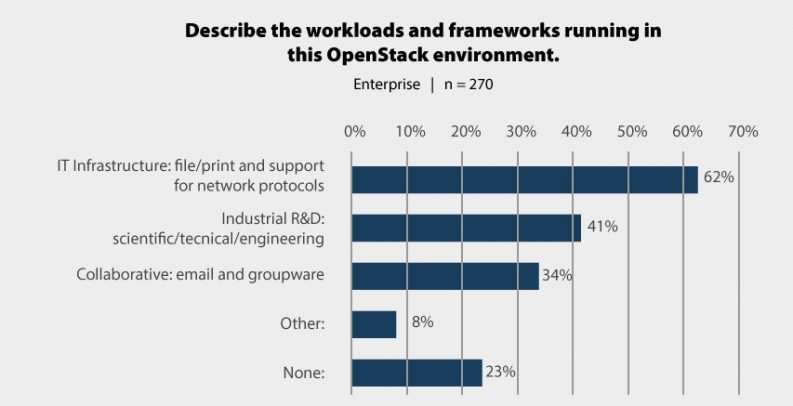
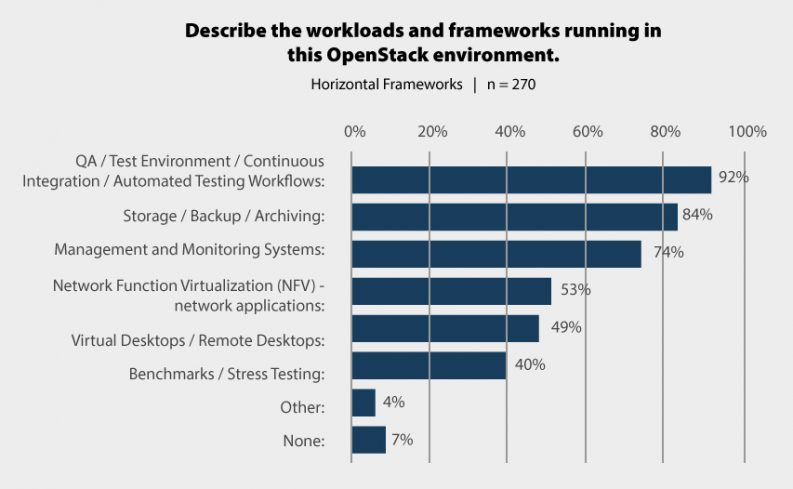
Workloads
There were significant changes to the workloads question in this survey, breaking out workloads into three categories: “service,” “enterprise” and “horizontal.”
Deployment Profiles
Hypervisors
KVM remains the most popular hypervisor by a long way, though a rush of bare metal deployments, up 5 percent, was seen over the past six months, with the use of container technologies also increasing. Over the same period, small decreases in the use of KVM and VMware, with small increases in Hyper-V and Xen-based hypervisors.
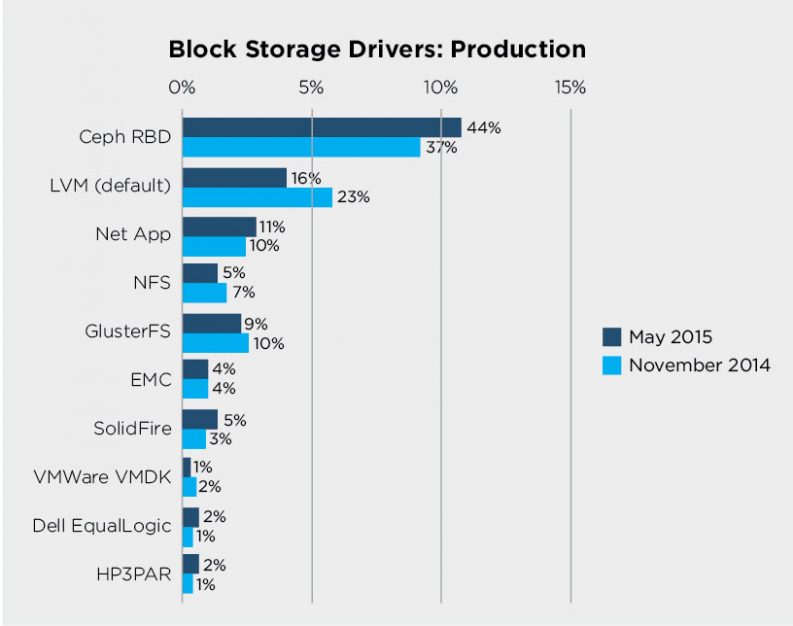
Block Storage Drivers
Ceph continues to be the most popular storage driver, gaining 7 percent since the last survey. A difference in this survey compared to last is that this question was only asked of respondents who previously noted that were using the Block Storage (Cinder) project. This could explain the large reductions in the use of LVM, which is a commonly used storage technology regardless of Cinder usage.
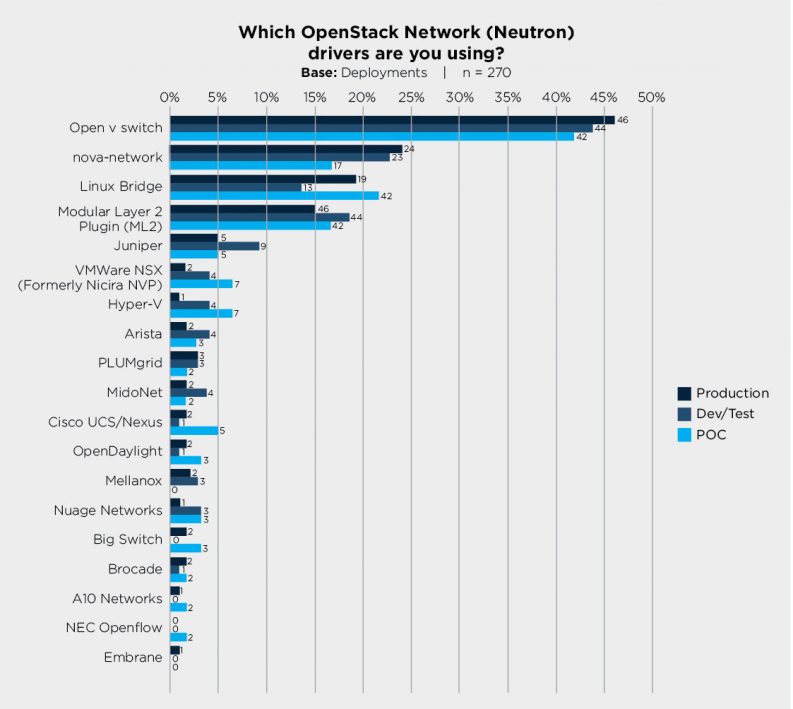
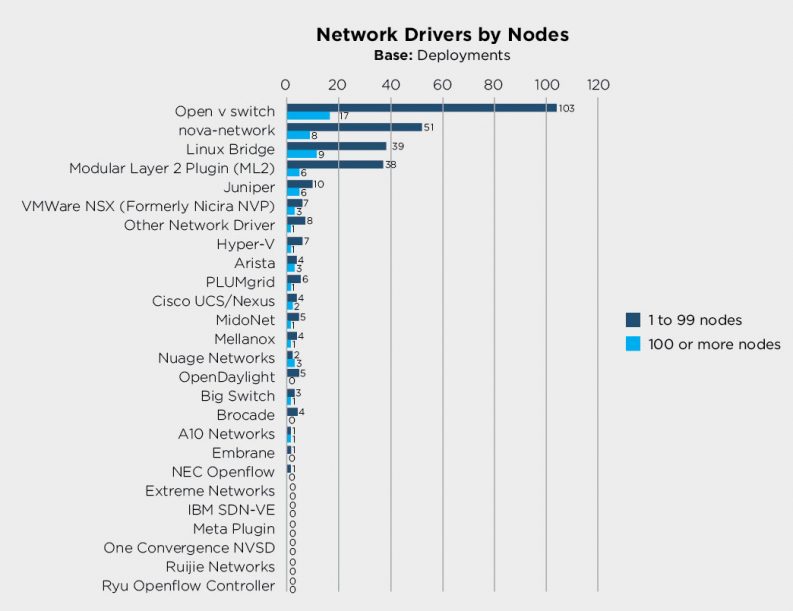
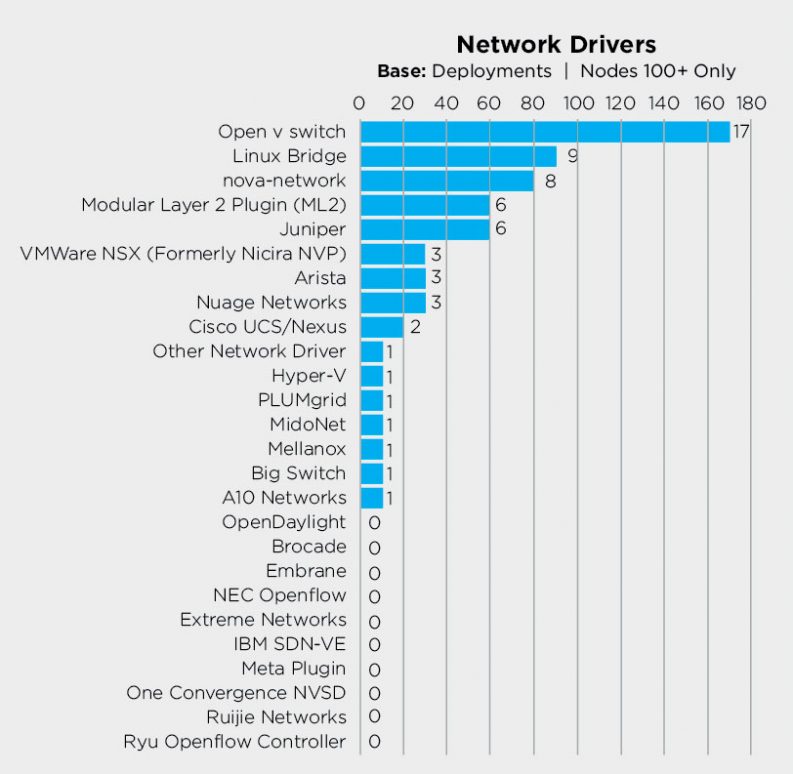
Network Drivers
In terms of network drivers, OpenvSwitch returns similar numbers as six months ago – 46 percent of production deployments, converting a few, with nova-network still holding strong at 24 percent of all production deployments in second. Linux bridge has gained 5 percent, remaining in third. Increases also seen in the use most vendor-sponsored drivers especially in regard to proof-of-concepts, although the Cisco driver showed a decline across all deployment categories. About 4 percent of respondents are on a driver not shown on this graph.

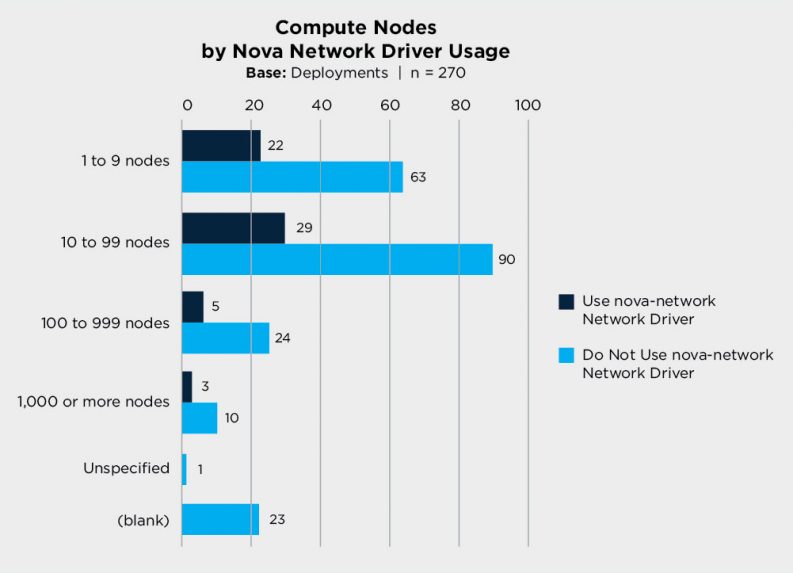
There appears to be no real relationship between the use of nova-network vs. neutron in terms of scale of the compute deployment – both are seen across small and large deployments in similar percentages.
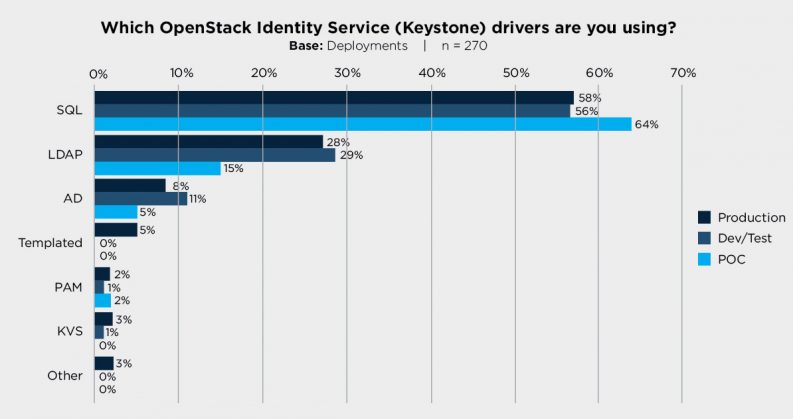
Identity Drivers
SQL continues to be the most common, with Lightweight Directory Access Protocol (LDAP) and Active Directory retaining their spots in second and third compared to six months ago. A significant change in this survey is the increase in use of the Templated backend, now used in 5 percent of production deployments.
Deployment Tools
More than 50 percent of production deployments are using Puppet as one of their tools, and this trend carries through to the community with the puppet-openstack modules being recognised as an important project. Ansible gained another 5 percent of production deployments, with more than a few reporting that they use a combination of Puppet and Ansible to manage their cloud. Fuel has lept up from the “other” category last survey to third place, narrowly beating Chef which suffered a decline in respondents this survey (down 12 percent). Interest in CFEngine and Crowbar was also lower than last round. On the devstack-in-production front: only three reported this odd usage pattern on this occasion, and two of them are also using other tools (Puppet and "other tool" and Puppet and Saltstack respectively), so it’s probably safe to assume they were likely talking about the development area of their production cloud.
Operating Systems
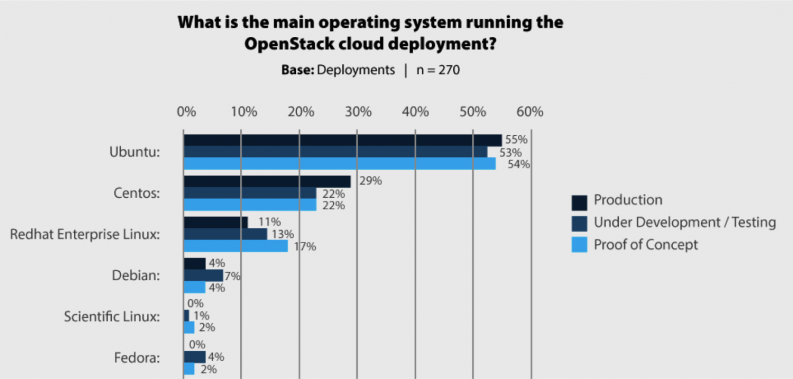
Over the past six months, the share of production CentOS-based deployments have risen in popularity – gaining about 10 percent, while Red Hat Enterprise Linux and Ubuntu production deployments have fallen by a similar number. This is accompanied by a corresponding drop in Dev/QA and Proof of Concept deployments in CentOS, down 10-15 percent compared with November last year – potentially indicating these came to fruition. Ubuntu’s gained 5 percent in proof-of-concept deployments which have often been converting into production deployments in later surveys. Debian holds its own in fourth place, returning similar numbers to six months ago. About 2 percent of production deployments use an operating system not mentioned on this graph.
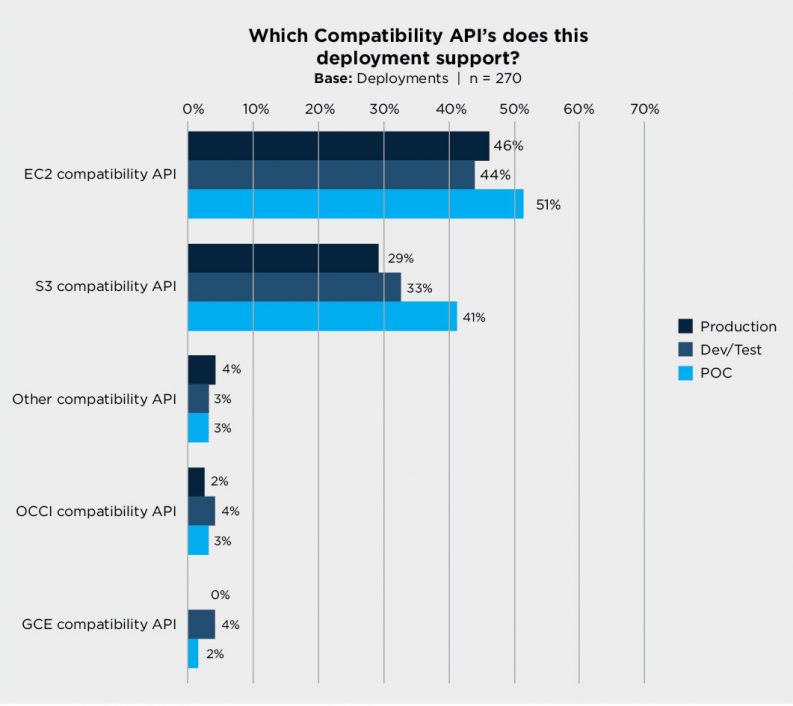
Compatibility APIs
Production usage of the EC2 (up 2 percent) and S3 (up 5 percent) APIs has increased over the past half year, with OCCI (down 2 percent) and GCE API (down 1 percent) usage remaining low. The increase in “other compatibility API” in this round is due to this question being accidentally marked as mandatory for a short period of time – most entries here are simply “none.”
Spotlight Questions
Each survey we ask several questions on specific topic areas of interest to the community.
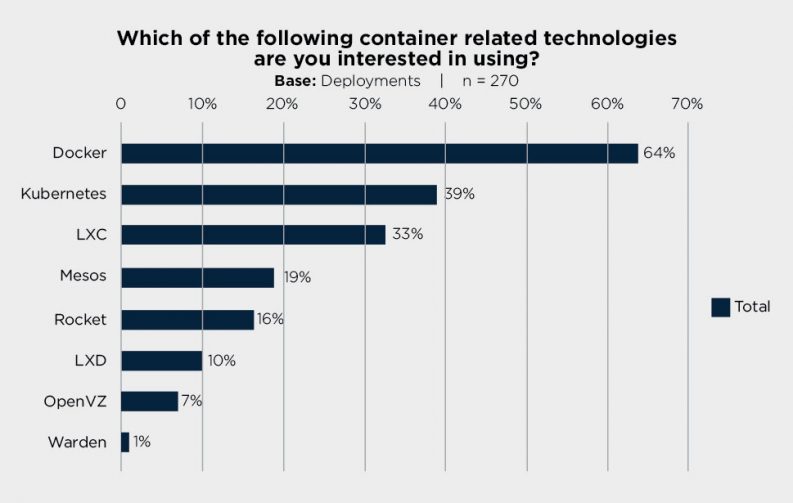
Interest in Containers
This was the first time users were sounded out about this hot topic. Of the users who expressed interest in containers, below is the breakdown of the particular projects they are interested in.
Packaging
At recent ops meetups, there have been a number of discussions on distribution packaging for OpenStack. When asked, many operators noted that they are creating their own packages. To further assess this across larger numbers, we added two additional questions to the survey this time: “What packages does this deployment use?” and, for those who answered that they were modifying or building packages, we also asked why.
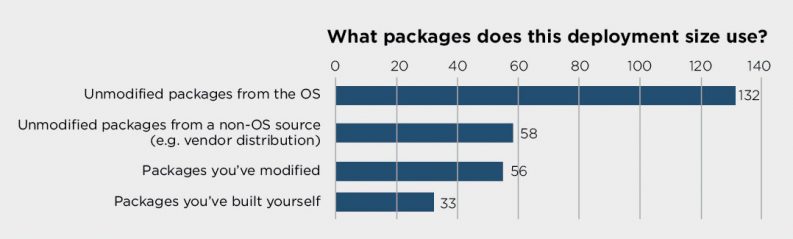
The result of the first shows the different audiences we reach with the ops meetups and the user survey. Majority of users (68 percent) are able to run unmodified packages. However, the remaining 32 percent of users need to modify or build their own packages is worth investigating further.
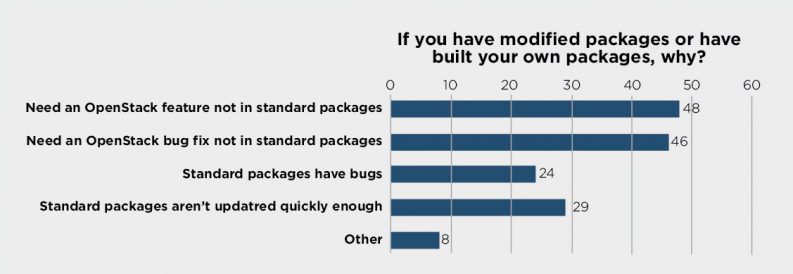
The good news is that the level of packaging bugs is relatively low – fewer people reported issues here. However, there was a strong result that the packaging process is too slow, or missing items that users need – whether a critical bug fix or a new feature that was added after the package was cut.
As one commenter noted, “Standard packages aren’t updated on a cadence that meets ours. At times that’s ‘not quickly enough’ and at times that’s "too quickly.”
Ceilometer
Although 43 percent of production deployments use Ceilometer, its adoption has not been rising as quickly as expected. So we asked deployers who weren’t using Ceilometer why they weren’t. There were dozens of comments related to stability and reliability, particularly at scale. A couple of comments noted that if a billing integration feature were included it might entice them to use it.
“often >10 minutes for a query”
“ reliable backend store (MongoDB is a lot of effort to maintain)”
“Fixing the data schema so it doesn;t explode in size.”
“Seems very unstable for very large deployments.”
“For it to actually work at scale- API queries take ages even behind a large multi-node Mongo cluster.”
“If it would work reliably and with decent performance- and we could trust in its development path.”
“It requires too much horsepower and maintenance for most private cloud situations.”
“Scalability issue: on our QA workload were generating so many data so default backend can’t even work with.”
“We don’t see Ceilometer as an operator tool. We see it as a tenant monitoring service”
“Were using it – but would like to see more rrd like capabilities so it is more stable.”
The OpenStack User Committee is led by Subbu Allamaraju, Tim Bell and Jon Proulx. This core group provides oversight and guidance to a number of working groups that target specific areas for improvement.
- Must-see Containers Sessions at the Open Infrastructure Summit Shanghai - September 16, 2019
- OpenStack application developers share insights - May 16, 2015
- OpenStack users share how their deployments stack up - May 15, 2015