)
Background
In preparation for the OpenStack Summit Paris in November 2014, OpenStack operators and application developers were asked to provide feedback on their experiences via a User Survey. This is the fourth consecutive survey conducted by the User Committee prior to each Summit starting in April 2013 and the previous survey in Atlanta, May 2014. The goals of the survey are to generate insights based on a representative sample of OpenStack users, in order to better understand their organizational profiles, use cases and technology choices across different deployment stages and sizes. These insights are intended to provide feedback to the broader community, and to arm technical leaders and contributors with better data to make decisions.
The survey is open permanently and all input is welcome at https://www.openstack.org/user-survey for the next summit in Vancouver, May 2015. Operators, Application Ecosystem and API working groups are working on this feedback during the Paris summit in November 2014.
Methodology
Over the last two years, managing the User Survey and analyzing results has become a large task for the User Committee with support of Foundation Staff. For the latest round, we decided to engage an external, independent research firm, Moor Insights & Strategy, to help analyze and report the data. Because it was their first time to be involved, this round of the survey has been a bit transitional as we work to refine the survey administration and reporting over time. We are hoping to lay the foundation to achieve greater insights moving forward. Specific updates and methodology as applied to the latest report:
- In this version of the survey, we decided to look at any surveys that were created or updated between 20 February 2014 through to 9 October 2014. This provides us with a smaller, but more representative sample current state of OpenStack deployments.
- Every survey we make many small changes to the survey, based on developments in OpenStack and after analysis of the results (the full list can be found at the end of this report). For example, questions with lists of drivers are updated, a few questions are added based on new trends and requests from the development teams for further input on “hot issues” or new features, and some areas are clarified based on analysis about whether they are being understood.
- One big change this time is the section “Your OpenStack Usage”, which is targeted to consumers of clouds will only be shown to respondents who have marked themselves as having this role type.
- Added new “Net Promoter Score” question, but the results were unstable. This was determined based on the fact that long-form comments did not match the associated numerical response – for example a broadly positive comment with a score of “1”. As a result, this was not reported. We need to provide better explanation or rating scale or take a new approach to gauge satisfaction in the next survey.
Key Insights from the November 2014 User Survey Results
As noted in the methodology, there have been more than 1500 responses to the survey since inception with more than 740 unique deployments recorded. We elected to focus on the most recent data for this analysis, because we wanted to capture the most representative sample when studying technology choices, trends and feedback. The results in this report are from 669 responses and 327 unique deployments over the last survey cycle.
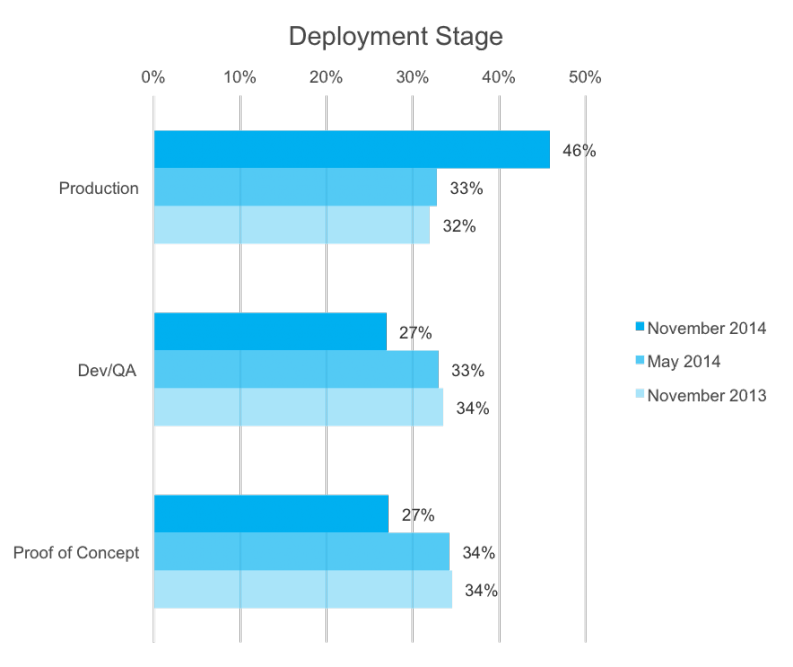
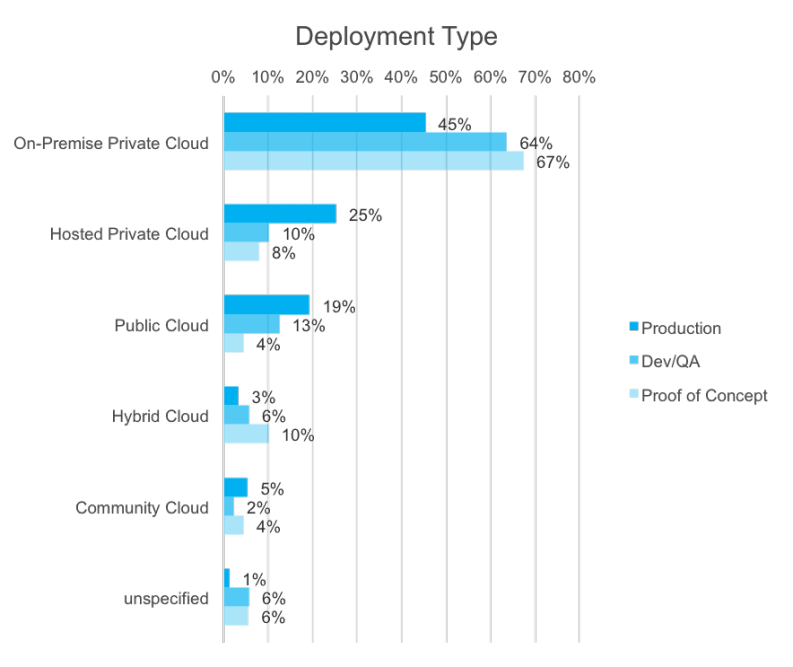
Deployment Stage & Type
Each deployment must be recorded as either Production, Dev/QA or Proof of Concept. Over the last six months, the ratio of Production deployments has increased from 33% to 46%.
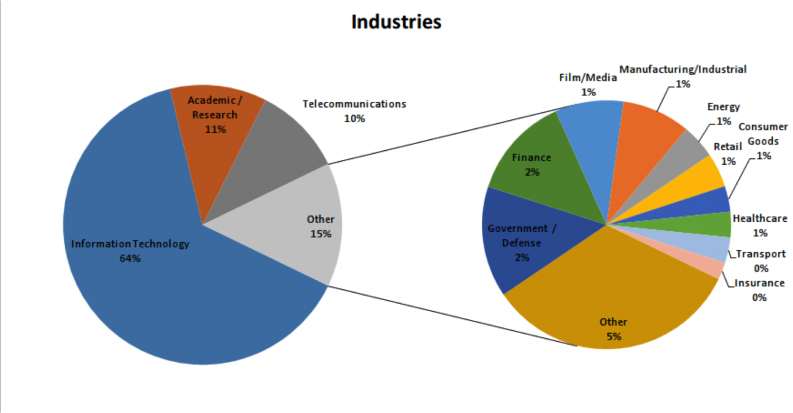
Industry Representation
IT continues to be a strong industry, but other industries are gaining steam. With the growth of industry use, the share corresponding to Academic/Research has from 16% in Atlanta to 11% in this survey. Two notable changes were Telecommunications, which jumped from 6% to 10% representation and Finance, which increased from 0.25% to 2% of respondents.
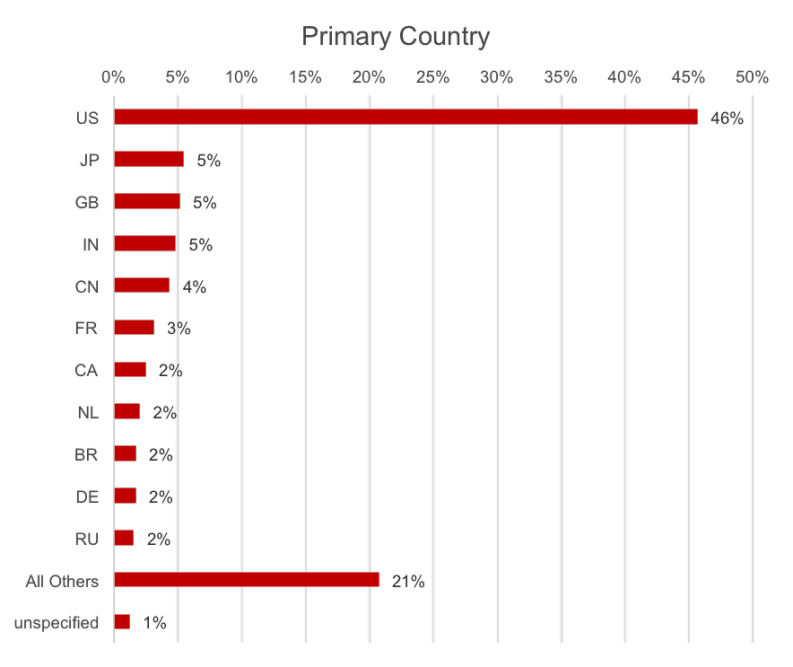
Global User Trends
OpenStack is a global community, and the user survey responses provide insight into the distribution and activity across regions. A notable move in the last six-month survey cycle was Japan, which jumped from 9th to 2nd in terms of respondents. Great Britain moved from 5th up to 3rd.
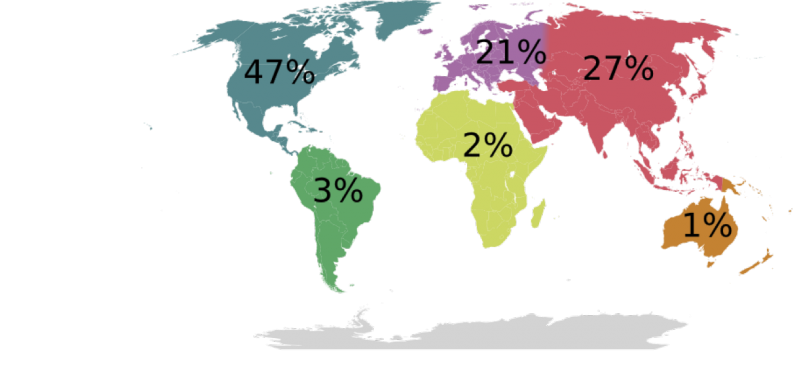
_Source for the map can be found at http://commons.wikimedia.org/wiki/File:Continents_colour2.svg_
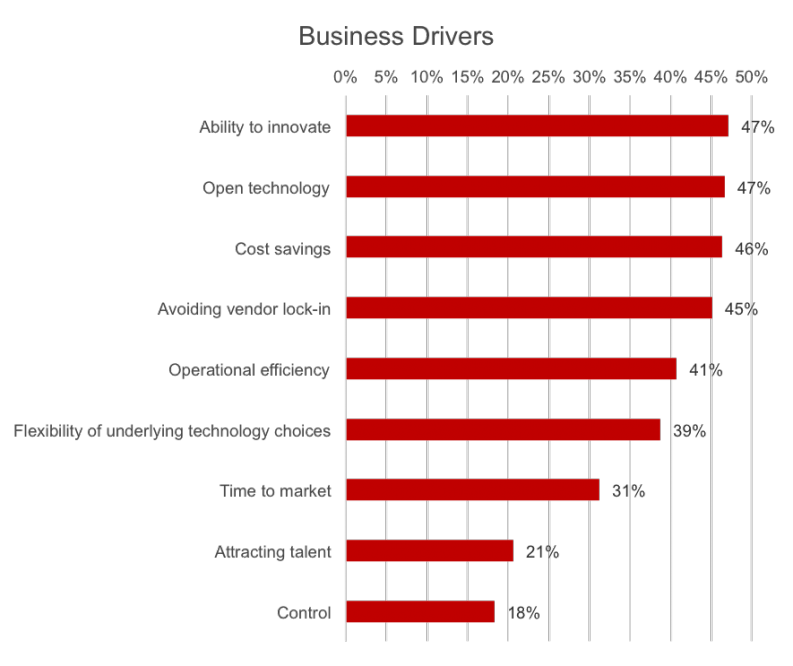
Business Drivers
The top four business drivers for using OpenStack are “Ability to Innovate, Open Technology, Cost Savings and Avoiding Vendor Lock-In.” The notable change was that “Ability to Innovate” jumped from the 6th most often cited business driver to the 1st.
Release Currency
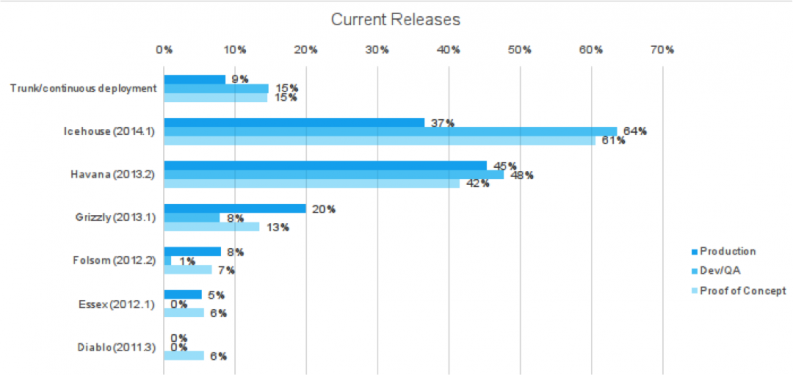
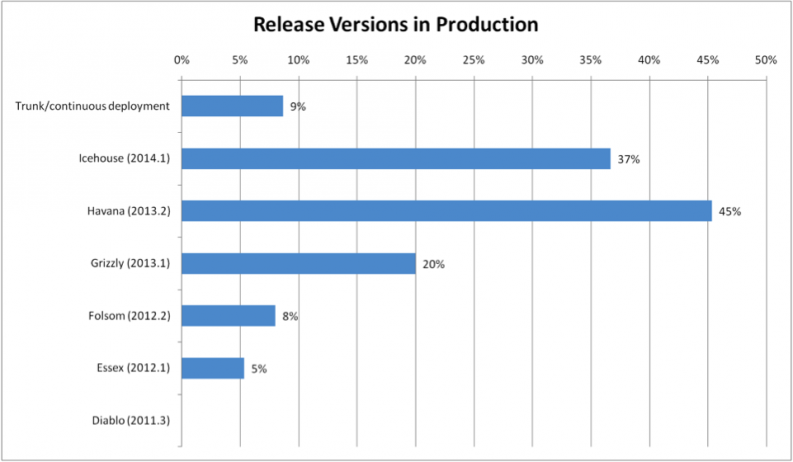
In the May 2014 survey 14% of Production deployments were running the most current release, while in this round 30% of Production deployments are running the latest release. Sixty seven percent of Production deployments are running either Havana or Icehouse (the latest two stable releases at the time this survey was conducted). This increase highlights a trend of faster upgrades and staying more current on the release cycle.
Project Usage
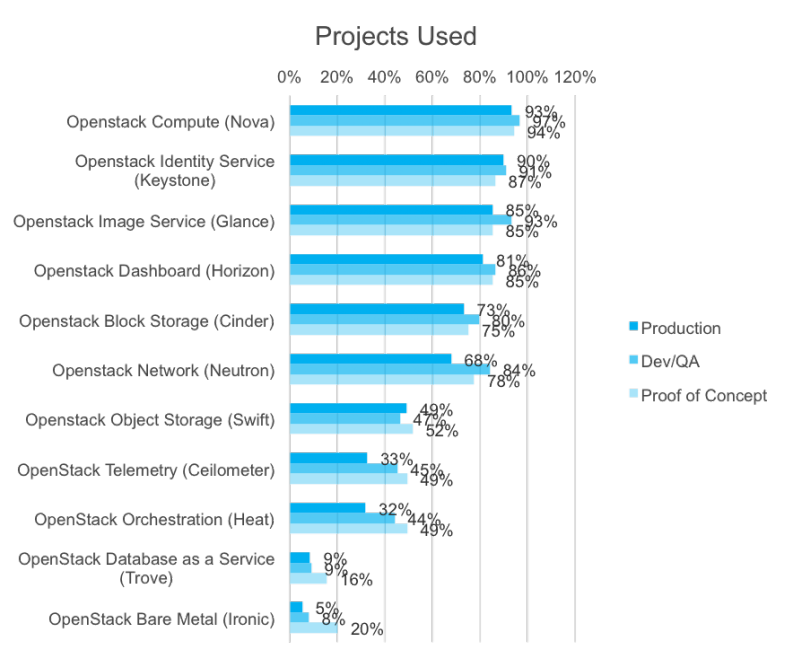
Production deployments of the more established services (Nova, Swift, Keystone, Glance, Horizon) have increased significantly since the last survey results. Many people are starting proof of concept and pre-production testing of the new components (Ironic, Heat, Trove).
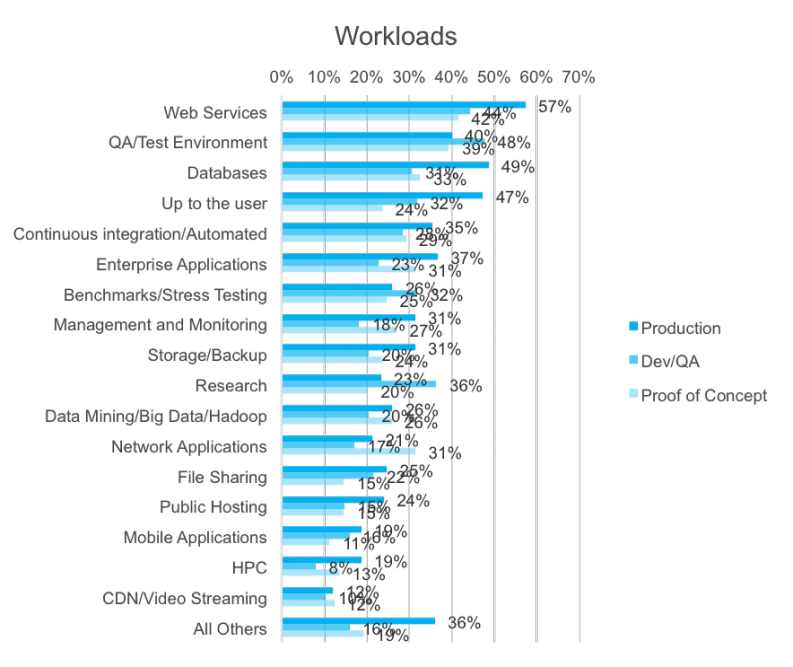
Workloads
Deployment Profiles
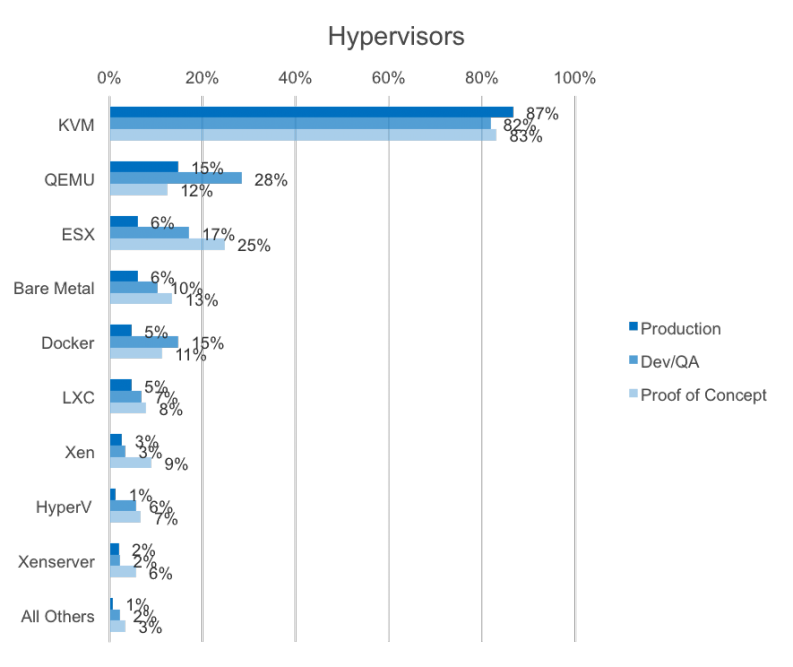
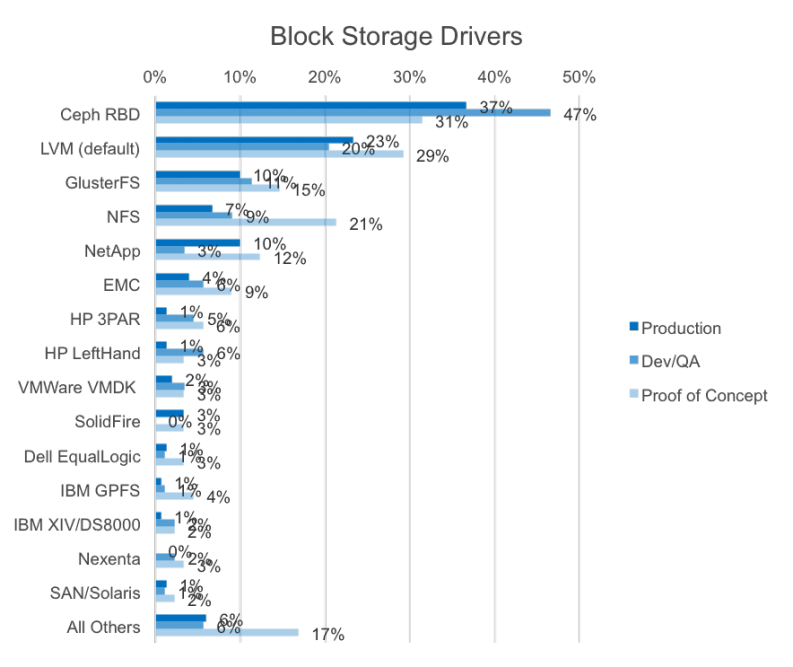
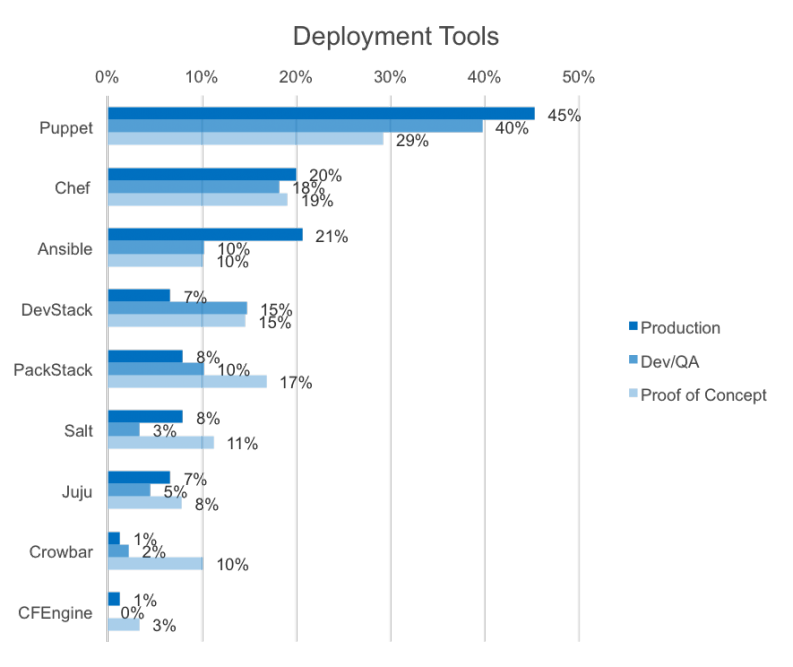
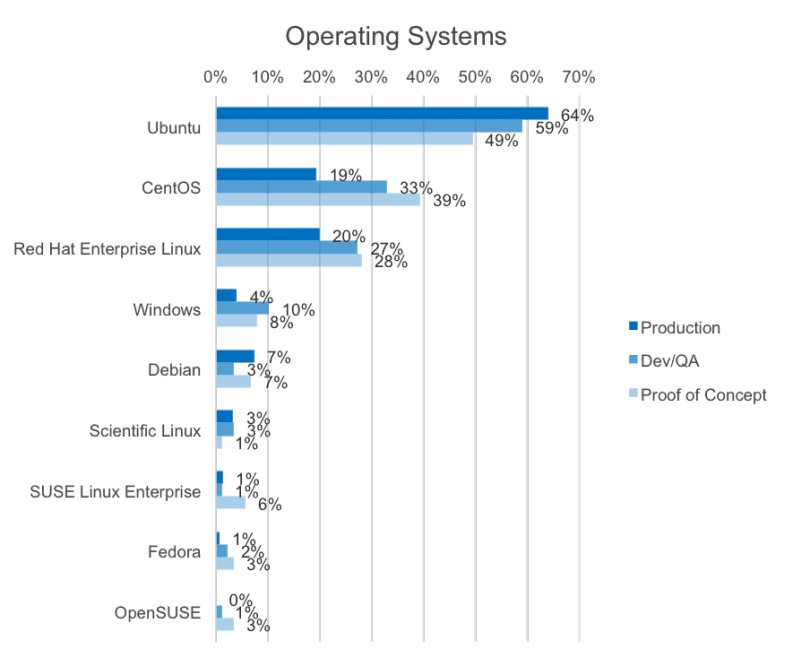
KVM continues to be the most popular hypervisor deployed with OpenStack across all deployment types. Ceph is the most popular Block Storage driver followed by the default LVM option, although the number of NFS proof of concepts is notable. For development tools, Puppet continues to be the most popular across all deployment types, but Ansible barely overtook Chef as the second most popular tool for Production deployments. Ubuntu continues to be the most popular operating system, but CentOS posted a growing number of POCs. Note this was the first time we asked about database usage, so we are not yet able to establish a trend.
Compute Hypervisor
Block Storage Drivers
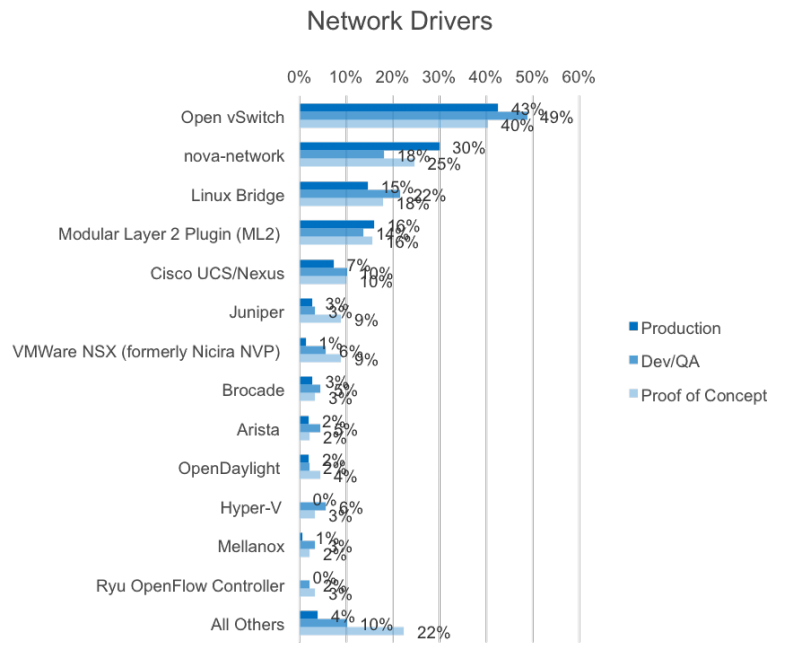
Network Drivers
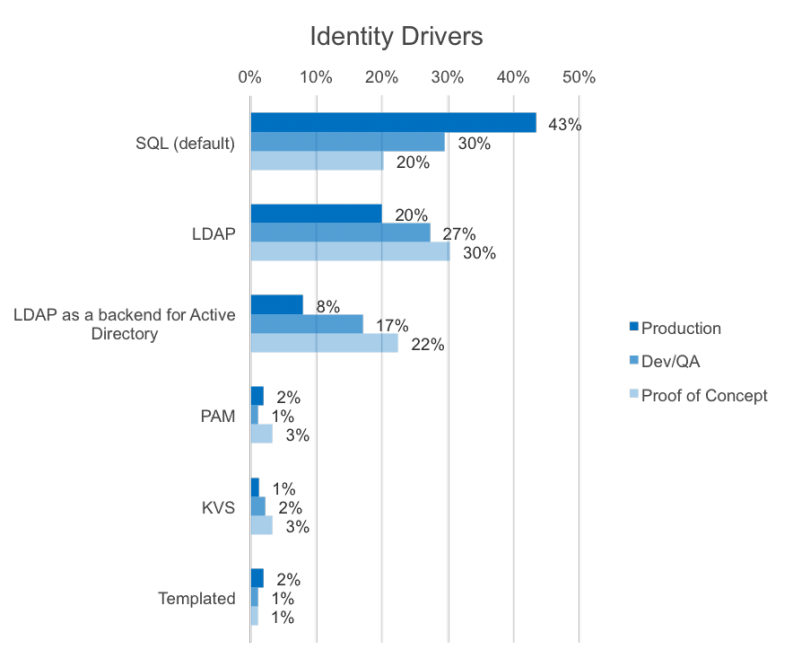
Identity Drivers
The use of Active Directory as a backing provider for the identity service has has grown significantly. In the previous survey publication, 3% were using it in Proof-of-Concept deployments, it is now 22%. Production deployments have also grown by 5%. The new features in icehouse and Juno mean it is now possible to do multiple backends such as read-only active directory and read-write SQL so future surveys (a new option for future surveys), and service users in AD/LDAP are no longer required, which should drive uptake further.
Deployment Tools
Deployment Operating System
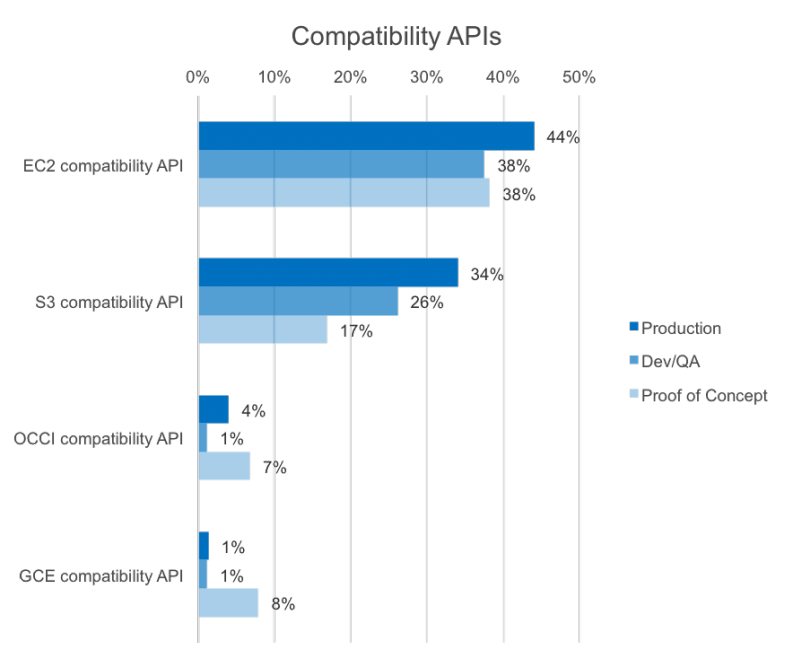
Compatibility APIs
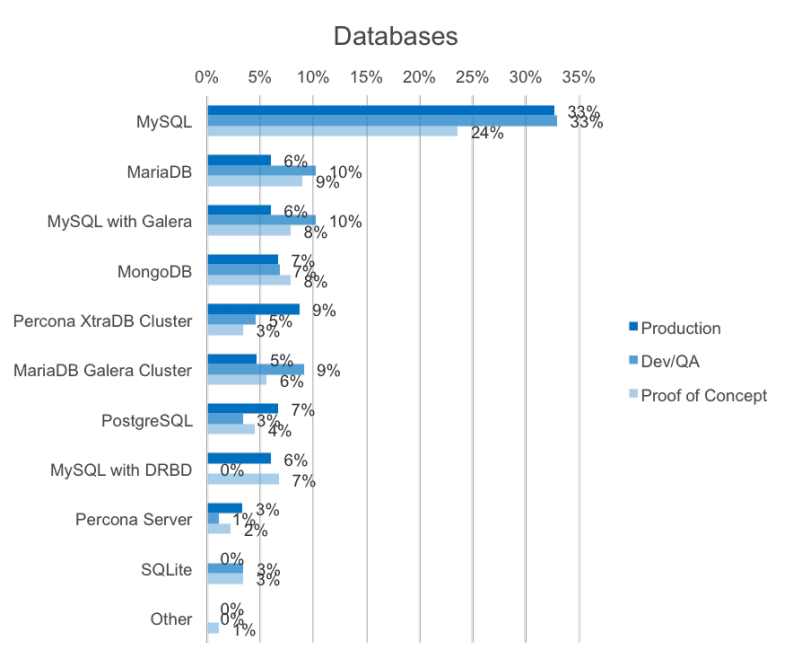
Databases
App Dev Insights
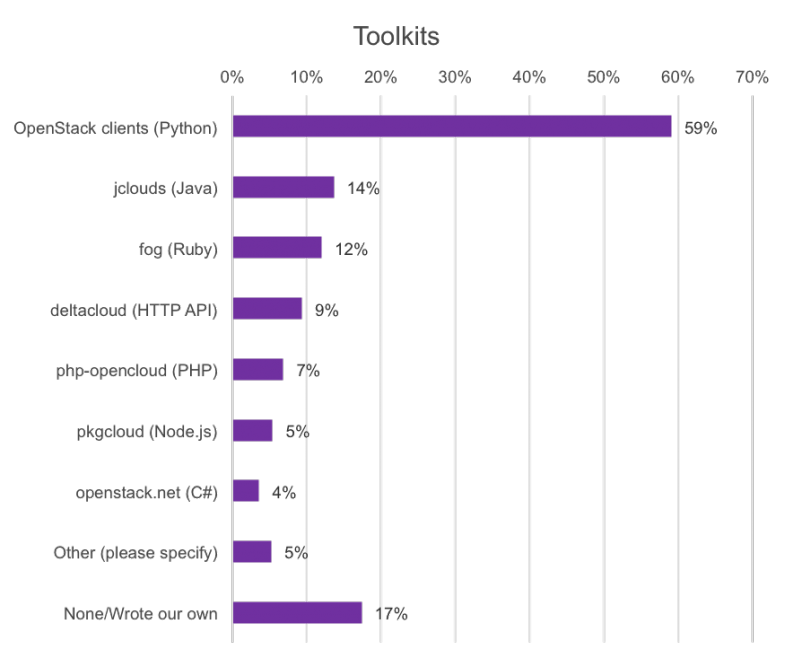
Correlated well with the most popular programming language (Python), the most popular toolkit to use when building OpenStack apps is the OpenStack Python Clients. Java with its JClouds SDK continues the trend. The results demonstrate there is a wide variety of client libraries in use, though there is still a reasonable number (17%) of folks who go directly to the RESTFul APIs.
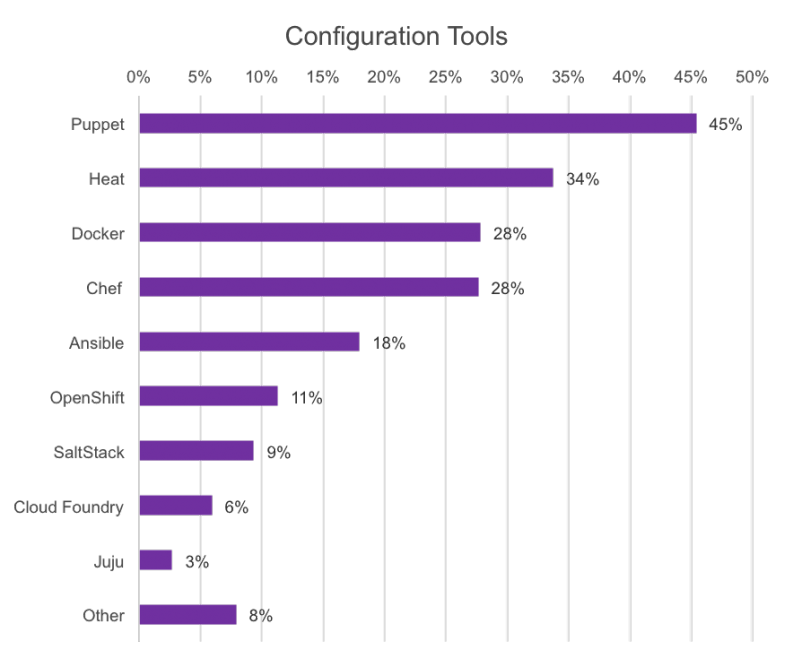
It is good to see the strong response Heat has received as a configuration tool for applications. Though more general systems configuration management tools remain popular, the use of other higher-level service oriented tools such as Cloud Foundry and Juju is rising.
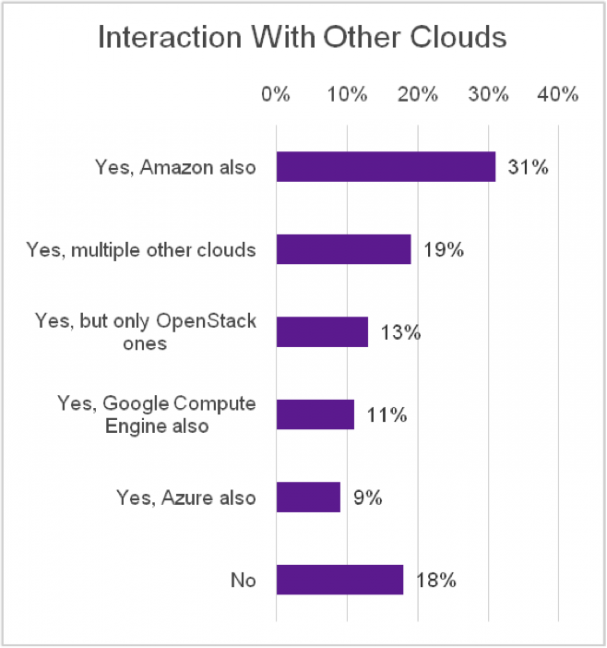
Though most did not respond to this question, it is clear that the use of multiple clouds is reality, with more than 80& of respondents noting the use of another public cloud. Nearly one fifth are making use of multiple other clouds.
Analysis of comments
When the comments across the various free text responses were analysed, Neutron remained at the number one area of pain (16% of comments). This was significantly more than the next response, Documentation (8.7%). Other issues affecting all projects, such as Upgrades (5.2%) and High Availability (4.4%) ranked next, along with a desire for a stronger dashboard (5.2%).
Following this were general comments regarding specific projects – Nova (3.9%), Ceilometer (3.7%), Heat (2.6%) and Keystone (2.3%). Of note is the combination of older projects with younger ones, potentially indicating that Ceilometer and Heat have a ways to go. Nova being a large, long-standing project would expect many comments.
Rounding out the top 10 was Logging (1.9%).
Specifically drawing out the comments around neutron, over 61% of them were general concerns, including performance, stability and ease of use. High Availability ranked second (11%), with SDN use cases and IPv6 requirements following (7%). Issues to do with migrating from nova-network to neutron were mentioned robustly (4%), with a strong desire to see a migration path. Feature-related issues rounded out the set – security groups (2%), NFV (2%), LBaaS (2%), with the exception of a special mention for stability – garnering a further 2% of comments just for this.
On Documentation, general commentary about feature completeness and in-accuracy ranked first, the top 44%. Following this was a desire for example reference architectures – with particular emphasis on real/in-use/in-production architectures (7%). The Depth of the documentation (6%) followed, with a small number of mentions of the install guide (4%), neutron documentation (4%) and a scattering of other remarks not necessarily well defined.
What do you like about OpenStack?
Overall, respondents loved the sense of community OpenStack has, in addition to its momentum. They classed the community as “broad”, “huge” and “growing” and liked that it was vendor neutral and non-proprietary, but vendor backed.
Similar to how we saw organisations see a business driver as “attracting talent”, individual respondents noted that listing the technology improves their resume and identified it as a sought after job skill.
“$$$$$$$$$$ Cha-ching best resume buzzword ever!”
On the more technical side, the modular architecture was seen to provide a big advantage. Flexible, fixable, self-service, extensible, modifiable, adaptable, hardware and vendor agnostic, interoperable were key words commonly sighted.
The API becoming a defacto standard and the good user experience were also positively mentioned.
Photo by Benjamin Chun // CC BY SA
- Demystifying Confidential Containers with a Live Kata Containers Demo - July 13, 2023
- OpenInfra Summit Vancouver Recap: 50 things You Need to Know - June 16, 2023
- Congratulations to the 2023 Superuser Awards Winner: Bloomberg - June 13, 2023


